Thursday, November 12, 2009

#25 September and October Performance


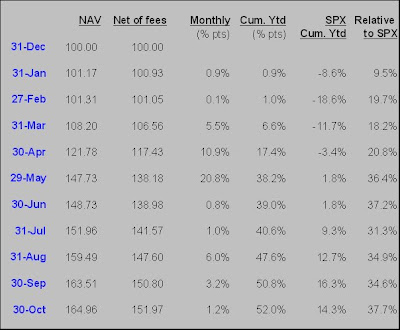
Sorry for the delay in posting Sep and Oct results. September was a fine month, up 3%, basically in line with the market. Some standouts were EMMS, UNH and PLA. We also added WLP during September, following the same basic theme as our UNH investment.

October was a relatively good month, up 1% compared to the -2% for the S&P. COT, MSFT and EMMS were the biggest positive contributor.

One name I want to discuss in this post is PLA. Admittedly I am late to describing the thesis since we added it to the book at a price of $2.50 on August 10th. However today the stock had a big move on rumors of a takeover bid so I think it is worth reviewing the original thesis below.

Over the years, we've followed a variety of media names, by which we mean cable, radio and content. The radio names are typically of interest because they generally have low capex and good free cash flow. The problem with radio is that private equity has already levered all the radio balance sheets so the fcf goes to pay down debt. This is why our thesis on EMMS isn't that the company is a great business (because we hate the leverage), but rather that it has interesting assets.

On the cable side, those companies also have great free cash flow, less crippling leverage than radio and are probably just fine businesses.

Content is something I've found intriguing since i became a fan of a French TV show called Star Academy. Note: here is a brief rant on how awesome Star Academy is. I saw just one episode (while on our honeymoon in French Polynesia) and thought it made American Idol seem like small potatoes. Basically, the show is a singing contest (like Idol), with a reality show component (like Big Brother), and the singers get to sing songs with famous people. PS-you can tell I like karaoke. PPS-here are some clips to show you what I mean:
Julio Iglesias
John Legend!
Anyways, the company that produces Star Academy, Big Brother and other reality-like shows is called Endemol. They got taken private at 15x+ ebitda in 2007.

So getting to the point at long last. Today, radio co's trade around 7x ev/ebitda, cable around 6-8x, and content (by and large) still 10+ turns. Why? Perhaps because it is an asset-lite model and the aura that good content is unique and hard to imitate. I set out on a mission to find "cheap" content. My two finalists were tickers NOOF (you can look it up) and PLA (Playboy). I chose to buy PLA (although I think NOOF is still interesting) because PLA was trading by my estimate, at <4x ev/ebitda and an attractive fcf yield. On top of this, you had asset support from: the Playboy mansion, the Playboy library and the Playboy brand (including licensing deals, etc). I was willing to make a bet on content, especially at an attractive multiple. I considered that PLA is a magazine publisher too (and magazines are having a tough time these days) but that didn't dissuade me. Hugh Hefner, the founder of PLA, continues to own a controlling stake and may be finally a willing seller. His daughter Christie, who until recently served as CEO, was replaced and a turnaround effort is in place as well. So that (ie, low valuation, iconic brand, willing seller, and if nothing else a turnaround story) is my basic, oversimplified thesis on PLA.
Tuesday, September 1, 2009

#24 August Performance


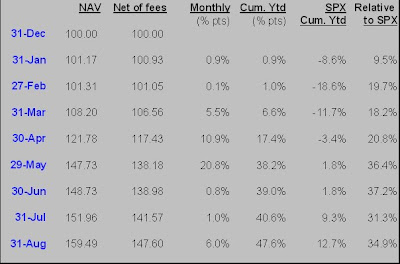
August was a better month for us, as certain positions (COT, DEI, EMMS) performed well. You can tell by our performance that we've been "struggling" the last few months to outpace the S&P; July was especially disappointing as we were up 1% compared to up 7.5% for the S&P. of course we understand that you can't beat the S&P every month, and we thought it was appropriate in July to take some gas off the pedal which is why the S&P gained on us. Still, we are happy with our ytd performance against the S&P but also mindful that we have to work harder than before to find ideas that will generate strong returns.
We decided to reduce exposure in two of the names that have worked very well this year, Cott and Douglas Emmett. With Cott, we feel that the market has come to appreciate the rebuilding story and the stock is no longer as cheap as it once was (remember we first bought in the $0.60 range). At the time we sold, the company was trading closer to book value and perhaps a 10x or high single digit PE multiple, compared to bottlers at 14x. While we think this gap should probably still narrow, we thought it was prudent to ease up and see how a summer cola price war shakes out. Plus, we are not entirely convinced that the shift to private label soda is here to stay. People like Coke and Pepsi. They don't want to drink Sam's soda the rest of their lives.
With DEI, we continue to believe the co has trophy properties, especially in the LA office sector. However, the stock reached a price point we had set in our head and while it seems like an interesting story, there is no shame in unloading the stock at $12 (we had bought in the $6 range).

Saturday, August 29, 2009

#23 July Performance


After a large rally in the S&P in the second calendar quarter, we struggled to find ideas that we liked a lot. One of our last trades in June was a short S&P500 ETF, a reflection that we thought the market might head for a pullback. However, July saw a continuation of strength in the market, so we redoubled our efforts to look for ideas that had not already benefited from the market surge.

One such idea, in fact the only one we purchased, was Emmis Communications (EMMS). We have been familiar with EMMS since 2005. At that time, EMMS was a radio and TV broadcaster, owning both TV and radio stations in many markets nationwide. The company was highly levered, and embarked on a subsequent program to sell its TV stations, repay debt and buyback shares over the next several years. In 2007 or 2008, the founder, chairman and CEO, Jeff Smulyan, made a bid to take the company private at a price over $10 per share. However the board and several large shareholders resisted this overture, indicating that they believed the "stick value" of the company was worth more than the price Smulyan was offering.

Stick value is a concept related to the value of each individual market in which the company braodcasts (think of a big antenna, or stick that broadcasts radio in a given market). EMMS, while a small company located in Indiana, owns several valuable sticks: NYC (Hot 97), LA (Power 105) and two stations in Chicago. The company also owns other radio stations in smaller markets as well as in Eastern Europe. The key angle to the EMMS story is that the NY and LA sticks are very valuable, in large part because they serve the two largest markets in the country and also because radio licenses are limited in number. If a radio player wants to enter a market, it has to buy a stick from an existing player; supply is limited.

Whereas valuation multiples for radio companies have been as high as 10-12x ebitda, the valuation for individual market sticks in places like NY and LA is thought to be much higher (15-20x or more). I say thought to be because these sticks trade infrequently and the multiples will vary based on the audience of the particular station.

Numbers-wise, at the time of our purchase, here is what we were looking at:
Market cap: $11m
Net debt (incl minority): $540m
Cash: $20m
Enterprise Value: $530m
EBITDA: $60m
EV/EBITDA: 9x

As one can see, nearly all of the value in EMMS is represented by the debt holders. I'd note that we did not have access to buying the bank debt so we concentrated our effort on the equity, which we think represents a low priced, long dated option on the survival of the company outside of bankruptcy.

Based on our estimate of cash flow per stick and a range of valuation multiples, we get a range of zero to $1.50 per share.

We bought EMMS shares at $0.30. Our biggest risk is that the company fails to maintain its covenant requirements (there are maximum debt/ebitda thresholds that start at 6x in Feb 2010 and step down after that) and the banks force the company into bankruptcy. However, some points ot consider:
-Smulyan founded this company and will do everything in his power to keep control. His control is through supervoting class B shares, so he is at least economically aligned with common shareholders like us.
-The banks (DB and BofA) likely don't care to see more of their loans default, nor do they wish to become owners of more radio stations. They are already granting many waivers to EMMS (and to other radio companies) to help these companies navigate through tough times. Hopefully this continues.
-Radio trends are starting to stabilize, ie, getting less worse as evidenced by 2Q earnings.
-If forced into a corner, EMMS would likely sell some of its stations to repay debt. The price they can get is uncertain however, as a buyer would need bank financing.

So overall, we know that radio trends are awful and that EMMS is among the most levered of all the publicly traded radio companies. We also know they are in danger of tripping covenants and a few steps away from having to be forced sellers of some of their prized assets. However, with an upturn in the economy and advertising (69% of EMMS revs come from local ad sales like car dealerships), there might be just enough improvement to stave off bankruptcy. If EMMS can be a survivor, the stock is worth well over $1 per share and possibly a lot more (each $1 in stock price represents $37m in market cap, a small number compared to $60m in ebitda and almost $600m in EV).

Wednesday, July 8, 2009

#22 June performance


June felt like a tough month to make money. Most of the names we thought cheap had already rallied in the March-May period, and with the market having rallied as well, there wasn't much of a rising tide to give us a boost. Still, the book was up 80bps and year to date we are at +39%, net of 0/20 fees.

We sold 75% of our COT position during June, most of it above $6.50, which was a well-timed sale (today the stock closed at $5.52). Our rationale (recall in an earlier post I thought the stock could be worth $8 but I promised to sell well before then) was that at $6.50, the stock was trading at 13x our EPS target of $0.50 and that the valuation gap to KO, CCE, PEP, and PBG had already narrowed substantially.

We also exited RX, taking a small loss on the trade. We just lacked conviction on the trade beyond the low PE multiple and figured it was time to move on.

We started a small position in SDS, a short S&P etf. Although the worst may be over, it is still hard to imagine how the economy can meaningfully improve with unemployment headed to 10% or more and more likely staying in the high singe digits for a long time. Expectations are rising that 2010 will be better, but we aren't yet convinced that it will be so much better to justify the recent run-up.

Overall, the well-timed sale of COT was the biggest contributor to the positive June performance. With that sale, we now stand at 26% cash, a level we haven't been at since end of March when we were at 30% cash. Looking to find more deals and "cheap options" on solid assets (things like our TTWO position).

Monday, June 1, 2009

#21 Performance thru May 29, 2009

The S&P 500 was up over 5% in May but we were able to keep pace with our positions and to outperform based on Cott (which nearly tripled during the month). We are now up over 38% ytd.


Saturday, May 23, 2009

#20 New position- COW

First chart: COW, which is an ETF reflecting the price of live cattle (65%) and lean hogs (35%).
Second chart: Live cattle prices
Third chart: Lean hogs prices


It is getting hard to find good investment ideas. The stock market is up substantially from its March lows and valuations have rebounded significantly. This leads me to (1)not want to chase stocks higher and (2)try to be diligent about finding ideas that haven't experienced the March to May rebound.

One thing I have noticed is that the price of beef has come way down. At the end of 08 (when I first started cooking at home), filet mignon at Costco was $10.99/lb. A few months later it fell to $9.99/lb and most recently it's been at $8.99/lb. I have also noticed that at our neighborhood Whole Foods, beef is often on sale, with NY strip steak most recently around $7.99/lb (a good price in NYC at a Whole Foods!). These observations led me to take a look again at COW - a livestock ETF. The COW tracks the price of live cattle (65%) and lean hogs (35%).

Here is an interesting article on falling beef prices.

It seems to me that there has been an overall decline in beef demand due to the economy, but also a glut of beef slaughters leading to higher supply. This has obviously led to a big decline in the index. One can argue that as the economy stabilizes, we should see a stabilization and improvement in demand (and hence prices). We would add that buying the COW is also a derivative play on livestock feed, primarily soybean and corn. This is the primary reason for our position.

Below are some recent charts on soybean and corn futures. There is presently a shortfall of soybeans from Argentina (which accounts for 20% of global production) and a delay in Midwest corn plantings due to rain. Our thesis is for both livestock demand to improve and for supply to shrink (based on higher recent slaughters and higher input costs). We have built a roughly 6.5% position in COW at $30.


Tuesday, May 12, 2009

#19 Sold USBp

Sold the USB puts. Got lucky that the co decided to raise capital ($2.5b common stock offering at $18 announced last night/this am). Stock trading at $17.50 now so our 19 strike puts are in the money ($1.50 itm which is the premium we paid). We sold them at $1.70 figuring we were wrong on our stress test thesis and lucky to escape this having actually made money on those puts.

Overall, the market feels range bound now. Stocks are sharply off their lows and banks have gone thru the stress test. Bears like to talk about commercial real estate which is a 100% legitimate concern, but it isn't like that is anything new. CRE should have been a concern in January (before CNBC started talking about it). There may still be markdowns left, but between the stress test and various government programs to support real-estate backed loans, I think we can reasonably hope that CRE won't fall as much as residential. I think the market has priced in a lot of these concerns. Still, you won't see us going long any banks. Hardest part is finding reasonably priced stocks. The S&P 500 at 900-ish levels imply a 15-16x p/e multiple for the market, a level that we don't find particularly cheap. We're going to hang onto names like MSFT (12x p/e, 6x ev/ebitda) and look for names that are either cheap (not that many) or offer a better GARP-like (growth at reasonable price) valuation.

Thursday, May 7, 2009

#18 Dead wrong

Dead wrong on USB (no capital required) and STI (needs capital equivalent to 1/3 of their mkt cap). Good thing I am not a banks analyst. At least it was a small position. On the bright side, COT has saved us so far this month and UNH, ETR and TBT were strong performers today. YTD up 29.7% net of fees, due mostly to COT (up 200% this month).

Monday, May 4, 2009

#17 New Position: USBp

Bank stress test results are supposed to be released on Thursday. As an exercise, I went through 10k's and sellside reports to compile data to do my own stress test. My numbers came out pretty clear in favor of Suntrust (STI) and against PNC and USB. This is the exact opposite of consensus opinions that favor USB and PNC and hate STI (bc of the Southeast (FL) exposure). To have some skin in the game, I did want to be long the name I like and short the other two. However i am cognizant that these names can rip hard and fast in either direction so I thought it would be more prudent to minimize downside by buying options. With stocks up today, the calls are more expensive so I have delayed in buying STIc and just took a 1% position in USB puts with May expiry.


#16 Sold BRK/B

Sold our BRK/B position at $3089. We bought it in the first week of March and earned a 27% return in 2 months. It stinks we have to pay short term gains on the sale, but I have been burned too many times in the past by not selling bc I didn't want to pay Uncle Sam. Berkshire held its annual meeting over the weekend and overall the tone, based on my read of news articles, was cautiously optimistic. The utility and insurance businesses will do fine (but not great) and everything else will be impacted by the economy. When we first bought the shares in March, we noted they were trading at around 1x book value. Now the shares trade closer to 1.4x book value if you consider the price appreciation since March AND Buffett's comments about BV having declined 6% in 1q09. During the 2005-2008 timeframe, BRK traded at an almost 2x P/B value--a reflection of the premium placed on Buffet's expertise. Going forward, sure the stock could go from 1.4x to 2x book value, but we prefer not to hope on multiple expansion to make us money, at least not to 2x when most insurance companies trade below 2x book. Plus, the book/earnings don't appear to be accelerating (again per press reports on Buffett's comments this past weekend). So we are happy to take our gain here and look for other opportunities.

Sunday, May 3, 2009

#15 Followup on TBT

This is why we are short 20+ year treasuries: TBT

Friday, May 1, 2009

#14 Position breakdown: April

I also included March for a comparison.

#13 April month-end results


April was a very good month for us, up almost 11%. Even better we managed to outpace the S&P's 8.3% monthly gain despite the fact that we were 30% cash at the beginning of the month. To give a recap of the year, our outperformance is mainly due to being underinvested in Jan/Feb and then having been fortunate enough to start buying in earnest during the March lows. Most of our picks (save RX) have worked, and they have worked very well. Unfortunately stock levels have rallied so much that it feels as if the easy money has been made. It may be that absurdly cheap (trading below asset value) opportunities like COT are no longer widely available so we are now looking at opportunities like MSFT or ETR where the market is either underestimating the earnings or the deserved multiple. I think this marks a shift from value based style to GARP (growth at reasonable price). Stay tuned.

#12 New position: TTWOc

On 4/30 we took a small (1%) position in Take-Two Interactive through Sep 15 calls (15 is the strike price). We paid $0.23 for each call, which is the right, but not the obligation to buy TTWO shares at $15 on the third Friday in September. TTWO is trading at around $9. First off, these calls are way out of the money. For us to make money, TTWO would have to rise to over $15.23 in September! That is a low probability event and explains why we were able to by a 4 month option for just $0.23.

However our thesis is that TTWO could be a takeover target. Last year, Electronic Arts bid $25 for the company and was rebuffed. We think it still makes sense for EA, or Activision (who has mentioned it is interested in acquisitions) or a large media company to make a bid again. A deal signed in September could close by February 2010, far ahead enough of the holiday 2010 season when TTWO's next iteration of Grand Theft Auto is scheduled to be released.

So this begs the question: why would anyone in their right mind pay $15+ (we think a deal could be had at $20) for a company trading at $9? Our answer is this: TTWO has a bloated SG&A and distribution system. A takeover by a larger player would allow the purchaser to eliminate (we think) at least 50% of TTWO's SG&A, which would be worth over $1 in TTWO eps. This means that if you put a 10x multiple on the post-tax synergies, you are getting a $10 value! This would also enable the deal to be accretive to the buyer's EPS. By the way both EA and Activision have large cash positions which make littl ein the way of interest income. Plus both stocks trade at 16x multiples (above TTWO's FY10 p/e of 10x)....all this leads me to think that a takeover of TTWO would be accretive to the buyer and thus a logical deal.

This is a small, 1% position because it is a lotto ticket. Our risk is that we lose our $0.23 premium. However our upside on a $20 deal would be $20-15-0.23 = $4.77. This is a 20:1 win/lose ratio for a scenario i think is possible.

#11 New position: ETR

We took an 8% position (4/27) in Entergy, a utility in the South (Louisiana, Texas, Arkansas) with a large Northeast nuclear plant presence. Our entry point was $64.27. ETR trades at an in-line valuation with the utility group but our purchase is based on belief that over time, the company's nuke portfolio will be worth more as the Obama administration and Congress become more focused on a carbon tax (nukes produce no CO2 emissions). Some sellside analysts peg the value of ETR's no-carbon nuke portfolio to be as high as $15/sh. We do not think this value will be immediately realized, but we have a long term view that over time this value will be recognized as policy is formed and timetables set. The second core reason for our purchase of ETR is that it is a long play on natural gas. Here is my attempt to explain why:

Power (electricity) comes from many sources, including coal, renewables, nukes and gas plants. The cheapest plants to run are nuclear and renewables (though they are mosre costly to build in the first place). The next cheapest are coal plants (US has lots of coal, but unfortunately it emits lots of CO2). Finally there are gas plants which are the most expensive to run, and their costs to run are driven by the price of the fuel they use, natural gas.

The curve below represents the electricity production curve. A few things to note: (1)the first power used is from renewables/nukes. That makes sense because you obviously want to use your cheapest sources first. As your demand for power increases, the utility company is forced to bring into operation the higher cost plants (coal and then nat gas). In most markets, the demand for electricity is high enough to require the operation of nat gas plants. In the case of the nat gas plant, the price of the marginal (or last) GW produced is the price charged for each GW produced regardless of source. If one follows the chart below along nat gas Curve 2, one can see that the profit at a nuke plant is the area represented by A. Additionally, when prices of nat gas are high (Curve 1)one can observe that the profit of the nuke plant is even larger (rectangles A+B).


The nat gas portion of our thesis is predicated on the gas curve (which looks like Curve 2) eventually looking like Curve 1. Presently the price of nat gas is roughly $3.50/Mcfe vs historical levels of closer to $6-8. If the gas prices do move higher, it will make all of ETR's nukes more profitable and worth more.

By the way, the reason for the low nat gas prices are: (1)low industrial demand in the US for electricity bc of the recession, (2) higher liquefied nat gas imports from abroad bc nat gas exporting nations are sending less to Japan and Korea (who are experiencing their own recessions), and (3)too much domestic production of nat gas. Eventually prices should climb again as US production is cut (we are already seeing drilling rigs down to 750 from 1200 a year ago) and industrial demand picks up.

#10 COT 1q earnings review

Going to make a quick comment after a 2min review of the COT earnings release:

Cott reported earnings this morning, reporting EPS of $0.23 and soundly beating consensus estimates of a loss of $0.05. The conference call is 90min away (and we'll probably have to read a transcript later), but the news looks very good so far. We had hoped that Cott might be profitable at a pace of just $0.10 per quarter and they more than doubled that. So what happened? In short, North American volumes were way up (thank you recession for giving us more private label soda drinkers), which in turn drove 13.5% gross margins (whereas we are at 9.5% for the year). SG&A was higher than we would have expected since, according to our notes, the guidance was for $65m in annual SG&A and this quarter SG&A was $35m (you can see our prior post on COT to get an idea of the model we had). Nonetheless, the beat on volumes and GMs more than offset higher SG&A. Again, we don't have the benefit of the conf call comments, but on paper, this was a very good quarter. As we've mentioned before, the best quarters of the year are over the summer months, whereas the calendar 1q is typically a slower quarter. We hope management will be cautiously optimistic in telling us things can get even better.

How good can things get is something we can only speculate on at this point. Most if not all sellside analyst reports I had seen expected a loss for the year. Based on today's earnings and the historical seasonal pattern of earnings, a $0.75 annual EPS number may not be crazy. This would depend however on no cola price war breaking out over the summer. If we haircut this to $0.50 (to be conservative), COT even at $2.50 (we expect it to trade up today), would be trading at a 5x p/e. This compares to 10x-12x for bottlers like CCE, PBG etc. Thus, I think this stock could be a double from here even on conservative numbers (if you give a 10x multiple on $0.50 in earnings), and on an optimistic scenario the stock could get to $8 (8x multiple on a potential of $1.00 in eps). So we have a long ways to go upside wise I hope. So far we have made 4x on our initial investment (where we bought the shares at $0.60 in early March)--not so bad!

PS: BTW, you might think we are crzy to think COT can get to $8 from $0.60 where we bought it...but just for a frame of reference, the stock has traded over $30 pre-05 and the average price in 2005-2007 was around $15. Not saying it gets back up there, but relatively speaking $8 may not be so crazy.

PPS: We are definitely, 100% going to sell before it even gets close to $8. This is a value/misunderstood story play, not a get greedy on eps and p/e multiple expansion play.

Sunday, April 26, 2009

#9 IMS Review

IMS also reported earnings last week. The results were in-line with expectations. IMS noted that business was being impacted by the macro slowdown, as well as f/x drags. Management also acknowledged that large clients were cutting back on spending, the consultants were operating at just 66% utilization and that there are few levers they can pull (besides hoping the economy gets better) to drive performance.

We had previously noted that we enjoyed paying a low p/e (<7.5x presently) on a great operating model (19% ebit mgn), but we also decided to consider other (like book or asset based valuations) metrics. Whereas in COT for example, we compared the value of the equity to the replacement value of the company, it took a little more work with IMS. IMS has a shareholder deficit of $255m; however, this includes share buybacks of 153m shares for $3.5b. Admittedly I need to get a second opinion on this, but I added back the bought back shares in Treasury to the share count, and added back the monies spent on the buybacks to shareholder equity; this would give me an idea of what the balance sheet might look like assuming they did not do a single share repurchase. I then calculated TBV, BV and ROE. This exercise does assume you can magically cancel the sharebuybacks (done at an average share price of $23, which considering the stock trades at $12 wasn't a smart move in hindsight).

IMS reported in line results for the quarter as well. There are no red flags to sell, but on second thought there may not be compelling must-have reasons to own the stock. IMS noted that business was We had previously noted that we enjoyed paying a low p/e (<7.5x presently) on a great operating model (19% ebit mgn), but we also decided to consider other (like book or asset based valuations) metrics. Whereas in COT for example, we compared the value of the equity to the replacement value of the company, it took a little more work with IMS. IMS has a shareholder deficit of $255m; however, this includes share buybacks of 153m shares for $3.5b. Admittedly I need to get a second opinion on this, but I added back the bought back shares in Treasury to the share count, and added back the monies spent on the buybacks to shareholder equity; this would give me an idea of what the balance sheet might look like assuming they did not do a single share repurchase. I then calculated TBV, BV and ROE. This exercise does assume you can magically cancel the sharebuybacks (done at an average share price of $23, which considering the stock trades at $12 wasn't a smart move in hindsight).


If we add back the $ amount of bought back Treasury shares, we get shareholder equity of $3.3b. Likewise, we'd have to adjust for those shares in the share count, which would rise to 334m. This gives us a BVps of $9.94, meaning RX shares trade at 1.3x book. Since IMS Health has grown over the years through acquisitions, we decided to calculate TBV by eliminating the goodwill. This gives us an almost $8 book value and 1.6x P/TBV multiple. Assuming it was fair to do this, we need to figure out whether 1.6x P/TBV is cheap, fair or expensive. (The only other industry I am familiar with where people try to justify P/BV valuations are in insurance, where they justify it based on how good the ROE is. In our case, it would appear the ROE on tangible equity is 12%. I think an insurance analyst would suggest that an ROE of 12% merits only a 1.2x P/BV multiple, 13% merits 1.3x, and so on.) . So I guess the applicable questions are (1) is the book value representative of the value of the business and (2)how much above book value might we be willing to pay?

The hard thing for me to figure out about IMS Health is what the intrinsic value of the business is. On the one hand, there aren't hard assets like factories or land or equipment that can provide us a floor. This business's main assets are the data gathering and analysis they do--their employees do this based on the company's corporate partnerships are relationships. During tough economic times, the fact that a company's main assets are people and relationships is not such a good thing; I would much rather prefer something tangible like a plant. During boom times though (when you hear about things like the war for talent), these people and relationships get valued much higher. I would argue that IP tends to be undervalued during bear cycles and overvalued during booms. We are clearly in a bear period now (debatable as to whether a bull cycle is beginning) so my inclination is to not to fight the macro and put too much value on the IP (intellectual property). This increases my inclination to sell should a better opportunity arise. For the time being though, I am comfortable owning the stock ($12.33 at Fri's close) near where we bought it ($12.50 ish). It does appear cheap on a multiple basis, but it is hard for me to tell whether it is a steal based on asset value.

#8 Earnings: UNH and MSFT

United Healthcare reported earnings 13 cts ahead of consensus ($0.81 vs. $0.68) on Tuesday am. However the company maintained full year EPS guidance of $2.90-$3.15, thereby implying that quarterly eps for each of the remaining three quarters this year would be lower than consensus. This, I think, is why the stock ended the week down 5%. Likewise, Wellpoint, THE largest managed care company (I had earlier written UNH was), also beat earnings this week but guided to lower targets for teh remainder of 2009, and it finished 2.5% lower on the week. Overall, the op mgns of 7.6% weren't the greatest (they've been 100-200bps higher in the past), but it appears there could be room for improvement. Both UNH and WLP suggested that the medical loss ratio (percentage of premium revenue spent on medical care) would rise in the coming quarters as members on high deductible plans work through their deductibles and the costs for the companies begin to rise. Nonetheless, using $3 in 09 eps, the stock continues to trade at just over 7x p/e ratio, well below historical norms (see the graph previously posted). We believe the low multiples are a result of market concerns over healthcare policy and we are comfortable making the bet that (1)profitbaility is stable and may eventually improve and (2) large managed care players like UNH are more part of the solution than part of the problem in addressing the healthcare needs of the United States.

Microsoft also reported in-line numbers this week. The stock reacted positively to cost control initiatives which could help drive profitability in future quarters. The company has a fiscal year end in the June quarter. MSFT's 2009 eps estimate is $1.72, compared to $1.86 in FY08. Consensus for FY10 is $1.84. Assuming flat (ie, 12cts lower than consensus) FY10 eps of $1.72, MSFT presently trades at 12.2x p/e, compared to 14.9x (866/$58) for the S&P500. Considering the proftiability of MSFT's business model (30%+ op mgns) and stable revenue outlook (supported by upcoming releases of Windows 7, Office 10 and other products), we believe it makes sense to continue to own MSFT here. Considering we initiated the position slightly higher than $16/sh and are now up 25% on the position, we do ask ourselves at what point we'd sell. So far our answer is: at a slight discount (14x) to the SPX: 14x p/e on $1.72 (flat eps) = $24.08.

Monday, April 20, 2009

#7 A little more on Cott

Last night PEP announced an offer for two of its bottlers, PBG and PAS. This is a change in direction for the industry as previously separating the relatively asset-lite brands (KO, PEP) from the asset intensive, low ROE bottlers (CCE, PAS, PBG) was thought to be a more efficient capital structure. These separations haven't been without their anxieties for the siblings because of concerns over pricing and marketing strategy between brand and bottler. Now PEP is proposing to bring everything (at least 80% of its distribution) back under one umbrella. My gut says these deals should close although one potential pitfall could be the cross-conditionality of the deals (ie, both must close else neither will) and I am not sure what the reaction of each board will be with respect to price and valuation. This complication could make it take slightly longer to negotiate what is effectively a three-way deal.

It will be interesting to see what KO's take is on this with respect to its own bottling operation. Also, the valuation offered for the bottlers (about 12-15x p/e) should help provide a decent valuation support for DPS (which has already rallied from $12 to $20 since early March (what a miss on my part!)). DPS or Dr Pepper Snapple Group, is the only one of the three main soda companies to have both brands and bottling under one umbrella. This had arguably caused a watering down of its valuation--brands like KO and PEP would trade at 15x+ p/e, bottlers would trade at 10x p/e, and DPS would trade 10-12x despite deserving a valuation between a bottler and a brand. One can argue DPS continues to be cheap here at roughly 12x 09 eps but I am staying on the sidelines as (1) i dont want to chase this after a 75% rally and (2) i am not sure what multiple DPS deserves as the #3 bottler. After all it isnt really a takeover target (at least not by KO or PEP for antitrust reasons) and we've seen lots of consumer/retail related companies struggle even from the #2 position (think home furnishings and home electronics as an example).

All this brings me to Cott. I really am not sure what the impact of this would be. Cott should benefit from the recession as there is a shift to private label. However the KO and PEP brands are so strong that in no way am I betting there will be a massive improvement. So, I wanted to illustrate below why we own Cott: (1) attractive on asset (pp&e) value basis (2) cheaper than peers on ev/ebitda and p/e, and (3) could actually make money this year provided we dont get into a summer price war in sodas. If i had one hope re: this PEP-PAS-PBG deal, it would be that we are less likely to see soda pricing wars, which would be immensely helpful to Cott as it tries to regain its footing.

Sunday, April 19, 2009

#6 Recent addition (4/8): TBT

The SPX has had a big runup since the March lows (up 27% by my calculation). It is nice to have made money during that time, but the big runup also makes it hard to find new investments. It is hard to know if we are out of the woods yet. It is encouraging that home sales are starting to improve and that banks feel good enough about contemplating a return of TARP money. On the other hand, I do still worry about the non-security assets on banks' balance sheets (ie the loans) which are probably being marked at generous levels. Quite frankly if there was a way to put on a trade where you were long marked down assets and short assets as yet to be sufficiently marked down, i think that'd be a good trade. Maybe that is a GS or MS vs. the commercial banks.

Anyways i am getting off track. There are two reasons for our purchase of TBT (200% inverse of the 20yr treasury):
(1) There has been a flight to quality in Treasuries, and I think the Fed has been buying too (albeit more of the shorter term bonds); however as sentiment improves, and inflation becomes more of a concern, Treasuries won't be as attractive.
(2) The size of the Obama budget and prospective deficits should make people relatively less optimistic about the US being able to pay its debts in 20yrs. The TARP and other bailout measures are effectively a transfer of toxic assets from the banks to the taxpayer, so why not short the taxpayer.

There are only 2 short ETFs on US bonds. One is PST, short 7-10yr, and the other is TBT, short 20yrs. We shorted the 20yr.

#5 Recent addition (4/1): RX

The other addition we made in the healthcare field is IMS Health. Here is how the investment came about:

I like cheap stocks (i admit there are many metrics but the two i most commonly use are p/e or ev/ebitda and book/replacement value). In the case of p/e ratios, I prefer to own companies with low p/e's but high operating margins. I figure why should I pay up to own a company with low margins? If I can own a company at 8x p/e and it has 30% ebit margins, shouldn't that be preferable to buying a company at a 15 p/e with 20, 30 or even 40% ebit margins? I have decided to call this idea a PEBIT (pee-bit) ratio. It is kind of like PEG (in which you conceptually are willing to pay a higher p/e in exchange for growth), except here you are willing to want to buy the stock that gives you the best operating margin bang for your valuation buck.

I ran a quick screen for US companies with p/e<20,>20% ebit mgn and EV>1000. Three hundred companies fit the bill and the top 1/3 had PEBITs of <0.3. A lot of these were financial names, commodity oriented names, or levered radio/broadcasting companies. However a few stood out (I was happy to see MSFT which we already owned came out on the list at a 0.25 PEBIT--8x p/e and 32%+ ebit margin), one of which was IMS Health. For a frame of reference, less than 1/3 of the companies in the S&P have a PEBIT of <0.5.

IMS is a medical sells market research for otc and prescrpition pharmaceutical products. Basically they sell prescription data. I was familiar with IMS Health from a previous investment project. In 2005 IMS Health had tried to merge with VNU, a Dutch company that also was in the measurement/data business--it owned Nielsen (the Nielsen ratings). The deal was blocked after shareholders of VNU argued they could gain a better return if the company were more efficiently run. It was a big Event driven idea in 05-06 (as arbs tried to reverse the deal and load up on VNU stock. The company was eventually sold to a consortium of private equity investors). During that time i was lucky enough to meet with IMS's management. Although I knew VNU shareholders weren't crazy about the deal with IMS, it was mostly because of their dislike for VNU management more than anything wrong with IMS. In fact i actually thought the IMS management seemed pretty good. I have to admit i didnt follow IMS much after 2006, but when i came across it a few weeks ago, the name did ring a bell. Plus, I figured good data helps companies make better decisions, so there may be something to their business. The stock was trading at $12.50, on eps estimate of $1.70 for 2009, or 7x p/e. I read the most recent earnings transcript for RX and the $1.70 seemed doable. Even more attractive was the company's 12mo trailing operating margin of 20-25%. paying 7x for 20% ebit margins in a business that I hope is not cyclical (like commodities) and should have a good macro trend seemed reasonable.

#4 Recent addition (3/23)-UNH

Two of our last three additions were in the healthcare sector. Before going into a brief description of those names, a few words on our investment philosophy. While we do not aim to achieve particular targets in terms of industry representation (ie, set percentages of the book in healthcare, tech, consumer), we do try to think from a macro perspective what sectors should outperform the market. We like to think of our approach as bottoms-up, but it is almost as necessary to have a good world view. It is foolish to think that one can do such good bottoms up analysis so as to overcome any macro challenges, so a basic tenet for us is that it is easier to make money with tailwinds than in headwinds. The problem with the current environment is that it is hard to know if we are in the midst of tailwinds or headwinds.

I am not a healthcare sector experts by any stretch. I have looked at pharma and biotech names from time to time, but still need to refresh the basics of CMS policy and Medicare Part D every time I start looking at a name. From a macro perspective, it appears that a few things are going on:
-patent cliff expiration for big pharma after 2010 (which is driving M&A)
-general concern that Obama's plans for healthcare (which I am not full aware of) will squeeze profits out of the industry
-general acceptance/expectation that healthcare needs to modernize which is a boon for healthcare IT.

I first started to look for healthcare IT names. One I came across was Athenahealth (ATHN) which provides internet-based services like billing and customer management for physicians. From a macro perspective this seems like a business I would really want to own, but the valuation (over 30x 2010 eps) seemed richer than I was willing to pay at the time. I think there is a good GARP (growth at reasonable price) story here but that requires more work. So, I moved along to low p/e names with decent ebit margins.

The first name I bought was United Healthcare (UNH). It is the largest managed care provider in the US. The sector has been hit hard over concerns about the new Obama administration and its yet unannounced healthcare initiatives. Other metrics worth watching are enrollment figures and operating margins. I admit that I need to do more work on this name (in particular operating leverage and book value) but when we added the position on March 23, the stock was trading at around 7x 2009 earnings. Incidentally, the consensus estimate for UNH appears to be around $3 in 09. Although that is slightly higher than 2008 (in today's environment it is important to do a gut check on whether you think consensus 09 ests make sense compared to what the results were over the past 5 years), I did like the fact that the 2007 eps appeared to be $3.50. Basically I don't think I am buying a business at peak profitability so I think the 7x p/e is a legitimate calculation. I took this 7x multiple and compared it to historical p/e for UNH. Again, it appeared to be closer to the low end rather than high end. (the green line below represents historical p/e). All in all, it seemed I could buy a key healthcare player on relatively conservative earnings at a conservative valuation. If (1) the earnings exceed expectations, (2) the market decides to value these companies at a higher p/e or (3) it turns out companies like UNH are more a part of the solution than a part of the healthcare problems in the US, this investment could make money.

Wednesday, April 15, 2009

#3 March and April breakdown


As you can see above, we increased our investments significantly in March and April. Cash went down from 48% of our holdings to less than half that amount by mid-April.

BRK/B: Berkshire Hathaway Class B (1/30 class A): I will not profess to be an expert on Berkshire. The majority of the business is an insurance business. There is also a utility (Mid-American), several wholly-owned subsidiaries (such as See's Candies and NFM) and the portfolio of securities (KO, etc). I read Warren Buffet's annual letter and gained comfort from a few things: (1) it didn't seem there were toxic investments in the insurance company's portfolio (unlike its peers) yet the stock had gotten hammered along with the peer group, (2) the underwritten equity puts had a little likelihood of causing damage and even in that case, damage would be manageable. In early March, the company was trading at close to book value, with the A shares were at $72,000 (book value) when I bought B shares at the equivalent $2400. I figure paying book value for a great insurance company with no toxic investments was worthwhile enough, and to have Buffett's expertise on top of that was a nice bonus.

COT- Cott is a Canadian based private label bottler of carbonated soft drinks (csd). I think their 10k says they produce roughly 60% of the csds in the US. I became familiar with the company in 2008 when I researched the Cadbury-Schweppes demerger. At the time there were rumors that Blackstone wanted to buy Dr Pepper Snapple Group (which later IPO'd as DPS) and combine it with Cott. A few things stood out to me. First, DPS spent a few billion dollars building a bottling plant in California (where it was under-distributed). To me, this means that the PP&E at Cott must be worth something. Second, Cott stock got crushed in 08 after Walmart said they wanted to end an exclusive relationship with Cott on private label csds--this would have a direct impact on Cott volumes. However to my surprise, in reading the transcript of the YE call, management indicated that volumes were holding up well and actually clarified that the WMT relationship wasn't dead, but that Cott would just need to compete for business rather than just be guaranteed it. i thought this was somewhat comforting. The recent price collapse of aluminum also was good for COT as it is the primary input cost. The negatives are that the co is still not out of the woods and probably needs to renegotiate with lenders in the next couple of years. I actually tried to buy the COT bonds (at 51) through Fidelity but alas Fidelity did not trade that issue. So my next choice was to buy the equity. Here is the quick math I did (although i lost the piece of paper where I actually did the math): the co has gross PP&E of X. I use the gross and not the net because i am choosing to believe the facilities (10 bottling plants i think) are still worth close to what they were booked at originally. The co has debt of Y (using par for Y, not the 51 level where it was trading). I got something like (X-Y)/shr count = $2.20. The stock was at 65 cents so I started buying. Added some more later around $1. Now at $1.23.

DEI-Douglas Emmett is an office REIT. I must have been crazy to have bought this stock--after all why in the world would you want to buy offices in a recession! Here was my rationale: the entire market was on sale during the first 2 weeks of March. During this time I decided to look up my mental list of "best in class stocks I would like to own but are too pricey for my tastes at the moment" and recalled DEI. I first came across DEI during the EOP (Equity Office Properties) days. Sam Zell was selling his office REIT, and a bidding war ensued among Blackstone and Vornado. Ultimately BX won, but I remembered from researching that situation, that VNO's geographic preference was in LA office property (not Orange County, else it would be interested in MPG); in trying to learn more about the LA office market, i came across DEI, the #1 landlord in LA, specifically West LA. Since then I have always looked at the price an valuation from time to time.

Assuming 3000 apts are worth $300k each (Hawaii, Los Angeles) = $900m. 13.3m sq ft of W LA office at $400 psf (vs Manhattan close to $600)= $5.2bn. Manhattan psf rents are $50/yr, or $600 at an 8% cap rate (cap rates had been as low as 5%, so I am being conservative); using 2/3 of that value in LA I figure might be ballpark. Another way to calculate is W LA rents are about $3.25/month, or $40 per year. Using a cap rate of 8% gives a property value of $4.8b. Assume a Total value is $$5.6-6bn. Less debt of $4.1b (incl minority interest), gives an equity value of $1.5b, divided by 122m shares = $12.25 per share. We began accumulating in the $6 range and last purchase was around $8. Plus most of the debt is recourse to property owned, rather than a claim on the entire company.

MSFT-bought around $16, then trading at a sub 10x p/e and ~6x ev/ebitda. This compares to the SPX trading at around 680 (during early March), assuming SPX eps of $60, or an 11 p/e. We liked the prospect of owning MSFT better than buying SPX--after all it has a 30%+ EBIT mgn.

Last 3 additions were UNH, RX and TBT. More on those another time.

#2 Position breakdown, Jan and Feb


I am going to discuss Jan and Feb first because (A) the inflection point in the market occurred in March and (B) I cannot figure out how to fit Jan-Apr charts together so I have to do two months at a time.

The most notable aspect to Jan-Feb is the vast out performance over the SPX (almost 20%%). We were able to preserve capital during January and February primarily due to the fact that (1) we were 48% cash, and (2) some longs, such as SBB (short S&P600) and DNA were able to offset losses in GENZ. The remainder of our positions were flat over this time frame, resulting in a net 1% gain through Feb 27.

To give a little more color:
OGZPY (Gazprom) was a position we had held for some time (over 2 years I think). The basic bull thesis is that the company is a monopolistic gas supplier to Europe, which gets 40%+ of its nat gas needs from Russia. The downside is that most of the Gazprom sales within the former USSR are at below market rates and unprofitable (a point of consternation over recent winters as the Russians have threatened to shutdown gas pipelines during the cold winter months). We were lucky to have sold 40% of our position during the energy peak in mid-08 at substantial profit. In 2H08-Feb 09, the price of OGZPY declined substantially owing to the fall in nat gas prices (caused by the global recession) and the collapse of the Russian ruble. We probably could have sold earlier had we not been complacent and distracted in our investment approach at YE08 when I lost my job. However, we decided to sell the rest in early March as we decided to refocus our efforts and to run our PA with a more professional approach rather than one consisting of whimsical trades. The decision to sell was not based on a particular bull/bear view of OGZPY but rather a reflection of trying to build a new PA with well thought out ideas supported by the type of valuation work I had done as a buyside analyst.

GLD (gold etf)-we put this position on in late 2008 as the markets melted down. At the time, equities provided little safehaven or comfort, and I thought the injection of money by the Fed and the US government would have inflatrionary effects. The trade worked well Nov through December and was flat afterwards through February. At the beginning of March, I thought the trade had become crowded, and I thought the macro environment had stabilized enough to the point where equities had more limited downside (owing to their 20% drops since Jan 1). Additionally, the recession appeared deep enough to make me worry about deflation rather than inflation so GLD was not as attractive. Overall I think GLD is a good investment when you fear infation and when you are afraid in general (too afraid to put on stock trades); by late Feb I thought these conditions were about to reverse.

DNA- was bought by Roche for $95. We sold the stock in March before the tender was announced. Had I not sold this position, I estimate performance would be better by 3%! What a miss! Still I have no regrets. This position was an event-driven position and I made a conscious decision that although I liked the deal as an arb, I did not want to trade too many arb-like positions in our PA as there were better risk/rewards out there. Despite missing out on DNA, we have still managed to significantly outperform the S&P thus far.

SBB- short S&P 600. Speaks for itself. Reflects bearish view we had at the beginning of the year. Sold this position at the beginning of March, a few days before the big meltdown. Still I don't regret the early timing as we raised cash and promptly used it to buy stocks during early-mid March.

TRV- legacy holding (10 shares) from the Citi-spin years ago. Because i am too lazy to figure out my basis (for tax purposes) I am just holding onto it until I do.

GENZ-sold in March. Owned for 2+ years probably and ended up being flat on the trade. At times we were up significantly, at other times down notably. I liked the protected nature of their business (many drugs have orphan drug status). I first became familiar with GENZ when I owned Shire in 2006 (a good trade for us). I had become familiar with Shire because I did extensive work on TKTX (Transkaryotic) which Shire bought in 2005 (an arb deal I participated in at work). I frankly just became frustrated with the stock and sold it to move on to something else.

#1 YTD performance of our PA


Welcome to the blog of our PA (personal account). I decided to keep this diary to help track the performance of my investment decisions. I have indexed the returns to a benchmark of 100 beginning Jan 1. Above is the ytd (year-to-date) performance. Note that the performance figures are based off of a 0/20 fee structure. The next post will have more detail on the portfolio of the breakdown.